Bond concepts
The ideas on this page apply to every bond: why its price is rarely £100, how to measure what it will earn, why its price moves when interest rates change, and what inflation does to it. If bonds are new to you, read what is a bond? first.
The examples use bonds that pay interest every six months, as UK gilts do. Where Alfolio works something out in a particular way, the section says so under In Alfolio.
Why a bond's price is not £100
A bond's coupon is fixed when it is issued. It is set in relation to the market interest rates of the day, so the bond starts life priced close to £100. After that, interest rates move, and the price moves with them, so that someone buying it today gets about the same return as they would on a similar new bond.
What the market rate is depends on who is borrowing. Investors want a higher rate from a borrower that is more likely to fail to pay them back. On the same day, the UK government might borrow at 4% while a company in difficulty has to offer 9% or more: its bonds are sometimes called "junk" or "high-yield" bonds. So each bond's coupon reflects both the general level of interest rates and the borrower's own risk, and its price also moves if the market's view of that borrower changes. When this page talks about "new bonds", it means new bonds from a similar borrower, for a similar length of time.
Suppose a bond pays 1% a year and new bonds now pay 4%. Nobody would pay £100 for it when they could get four times the interest elsewhere. Its price falls until its coupons, plus the gain up to £100 at maturity, add up to about 4% a year. With ten years left, that is around £75. If rates fall instead, older bonds with higher coupons become more valuable and trade above £100.
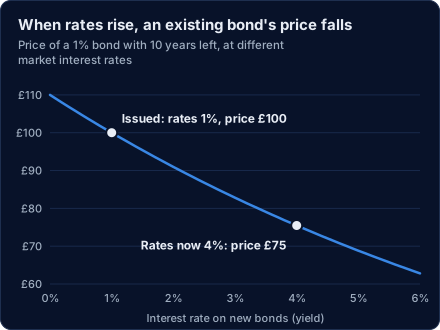
So a price below £100 does not mean a bond is a bargain, and a price above £100 does not mean it is expensive. It means its coupon is lower or higher than today's rates. The figure that takes both into account is the yield to maturity.
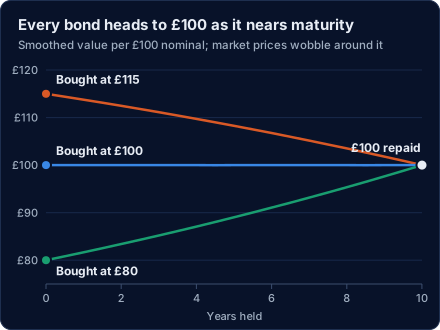
As maturity gets closer, the price is drawn back towards £100 whatever rates do, because there are fewer years of coupons left to make up the difference. That is the pull to par:
Yield to maturity
The yearly return you would get by buying at today's price and holding until the bond is repaid, counting both the coupons and the gain or loss as the price moves to £100. It is the best single figure for comparing bonds, and it is often very different from the coupon.
For example, a bond with a 0.25% coupon priced at £90 pays almost no interest, but you also get a £10 gain per £100 at maturity, so its yield to maturity is much higher than 0.25%. A 6% bond priced at £110 pays a lot of interest but loses £10 by maturity, so its yield is well below 6%.
The yield to maturity is only what you will actually earn if you hold to the end. If you sell earlier, your return depends on the price at the time.
In Alfolio:
- For a gilt, the yield is calculated from the latest closing price, as if you bought today.
- It assumes interest is paid twice a year, which is the convention for gilts. So it is not directly comparable with the hold-to-maturity return, which is calculated once a year and comes out very slightly higher.
A worked example: a five-year bond
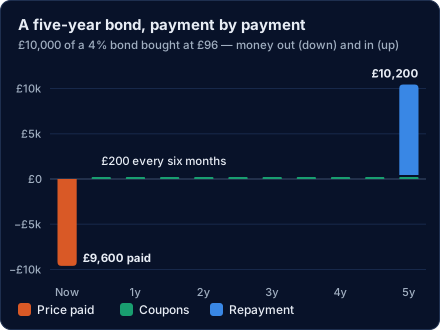
Take £10,000 of a bond with a 4% coupon and exactly five years to run, bought at £96. Held to the end, it pays £200 every six months and £10,000 at maturity, so you pay £9,600 and get back £12,000.
| When | What happens | Amount |
|---|---|---|
| Today | You buy £10,000 of face value at £96 | −£9,600 |
| Every six months for five years | A coupon: 4% a year on £10,000, paid in halves | +£200 each, £2,000 in all |
| In five years | The £10,000 is repaid, on the same day as the last coupon | +£10,000 |
| Overall | You paid £9,600 and got back £12,000 | +£2,400 |
Of the £2,400 profit, £2,000 is coupons and £400 is the gain from £96 up to £100. Spread over the five years, that is a yield to maturity of 4.91% a year: more than the 4% coupon, because of the gain.
In Alfolio: if this were a gilt, its page would show a yield to maturity of 4.91% and a Hold-to-Maturity Return of 4.97%. They describe the same return; the second is worked out with yearly rather than half-yearly compounding (see hold-to-maturity return).
The example was bought on a coupon date, so there is no accrued interest to pay. Buy between coupons and the cost includes a little extra, which comes back to you in the first coupon. For gilts this is explained in clean and dirty price.
Hold-to-maturity return and projected profit
Hold-to-maturity return is the yearly rate at which the money you would pay today grows into the coupons and repayments a bond (or a whole ladder) is projected to pay, if you hold every bond to maturity. It is the figure to compare with other investments. In the bond ladder it is labelled Annualised return.
Projected profit is the total you would get back, less the cost. It is split into two parts:
- Coupons, less the accrued interest you pay when you buy (you get that back in the first coupon, so it is not income).
- Capital gain: the repayment, less the clean cost. This is the pull to par. It is negative for a bond bought above £100.
The two are shown separately because they can be taxed differently: for gilts, see gilts and tax.
In Alfolio: it assumes payments received before the end are spent or held as cash earning nothing, not reinvested. The rate is calculated once a year, so it reads slightly higher than a yield to maturity for the same bond.
Running yield
A bond's running yield is its yearly coupon divided by its price: the income it pays this year as a percentage of what it costs. A 4% bond priced at £80 per £100 (80p per £1) has a running yield of 5%. It is a quick income figure, not the return you will get.
It leaves out the gain or loss as the price moves to its repayment value at maturity, so for a bond priced well below or above that, the yield to maturity is the better measure. A low-coupon gilt bought cheaply can have a tiny running yield and a much higher yield to maturity.
In Alfolio: a gilt's page shows its Running Yield where a share's page shows its dividend yield. It is based on the coupons paid over the last twelve months. For a modern index-linked gilt (issued since 2005) it is a real running yield instead: the real coupon rate divided by the real price, both before the inflation uplift.
Interest rates, prices and duration
When interest rates rise, the prices of existing bonds fall, and when rates fall, they rise. The longer a bond has left to run, the further its price moves. Duration puts a number on it: roughly the percentage a bond's price changes if yields move by one percentage point.
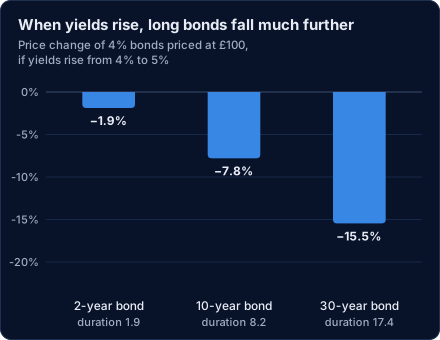
A duration of 8 means the price would fall about 8% if yields rose from, say, 4% to 5%, and rise by about the same if they fell. Longer bonds and lower coupons both mean a higher duration. It is an approximation, and least accurate for large moves: in the chart, the 30-year bond has a duration of 17.4 but falls 15.5%.
This only matters if you sell before maturity. If you hold to the end, you receive exactly the coupons and repayment you were promised, however the price moved along the way. That is why a ladder held to maturity can ignore price movements, while a bond fund, which never matures, cannot.
In Alfolio: a gilt's Modified Duration is calculated from its latest price, alongside its yield to maturity. The ladder's Weighted duration is a cost-weighted average across its gilts.
Yields and inflation
An ordinary bond pays a fixed number of pounds, so inflation quietly reduces what its payments will buy. Its yield has to cover that: part of the yield is the return investors want for lending, and part makes up for the inflation they expect while they wait to be repaid.
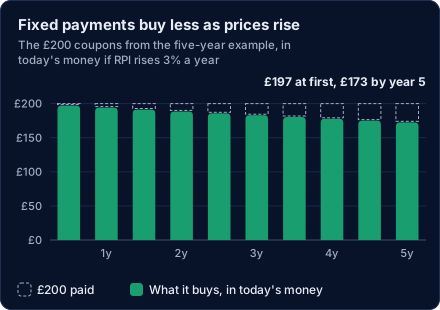
In the five-year example every coupon is £200, but if prices rise 3% a year the last one buys only what about £173 buys today, and the £10,000 repayment buys about £8,630 worth. Roughly, your return after inflation is the yield minus inflation: a 4.91% yield with 3% inflation is about 1.9% a year in real terms.
That is the risk in holding an ordinary bond for income. If inflation turns out higher than investors expected when you bought, your real return is lower, and nothing in the bond adjusts for it.
Index-linked gilts exist to solve this: their payments rise with inflation, so their yield is quoted as a return above inflation. Comparing the two kinds of yield gives the breakeven inflation rate.
Economic income, and why pull to par is shown separately
Cashflows shows money actually paid to you: coupons, then the repayment at maturity. Economic income spreads a bond's gain (or loss) towards £100 over the years you hold it, and adds it to the coupons. Only the coupons are cash. The rest is not paid to you until the bond matures or you sell it.
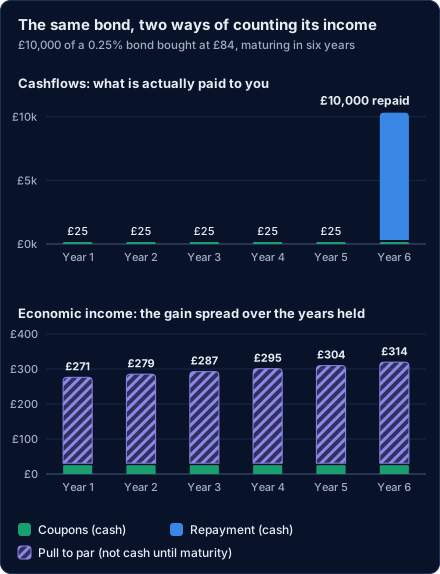
This matters most for low-coupon bonds. A 0.25% bond bought at £80 pays almost no interest, but it gains £20 per £100 by maturity. Counting only the cash makes it look like it earns almost nothing. The economic income view makes its return comparable with a fund that pays out regularly. The amount rises a little each year, because the gain builds on itself at the bond's yield, like interest on interest.
That gain or loss towards £100 is called pull to par. It is kept separate from interest, in its own striped colour, because it is not cash: you cannot spend it until the bond matures or is sold. For gilts it is also taxed differently, see gilts and tax.
How it is spread. Each bond's gain is spread at the yield it was bought at, the way banks account for bonds. Once bought, the schedule is fixed, and later price movements do not change it. A bond bought above £100 loses value towards £100, so its pull to par is negative.
Why some monthly bars go negative. A coupon pays about six months of interest in a single month. In the monthly view, the striped bar for that month drops below zero by about the same amount, because interest that had been building up is paid out as cash. The total for each month stays smooth. Over a full year, the striped part is just the pull to par.
In Alfolio:
- In the ladder and on a gilt's own page, economic income is worked out from today's price, as if you bought today. It is a planning view.
- In the income chart on your accounts page, it is worked out from the prices you actually paid. Some holdings are left out, because there is no purchase price to start from:
- gilts you have already sold (their gain is already realised);
- gilts transferred in from another broker;
- accounts that are not in pounds.
It runs only up to today and never appears in tax reports.
Bond funds and bond ETFs
A bond fund holds many bonds and never matures: as the bonds in it near maturity, the manager sells or replaces them. The ideas on this page still apply, but to the fund as an average, and with two big differences from holding a bond yourself.
- Nothing pulls a fund's price back to £100. A single bond held to maturity pays back its face value whatever happened to its price on the way. A fund has no maturity date, so if interest rates rise and its price falls, there is no date by which that fall is sure to be made good.
- Its income and yield change over time. As the fund replaces bonds at whatever rates are on offer, its income and yield drift with interest rates.
In Alfolio: on a bond fund's page, Yield to Maturity, Effective Duration and Modified Duration are the figures our data provider reports for the fund as a whole. Alfolio does not calculate them, and for some funds they are missing. Effective duration also allows for bonds that the issuer can repay early.
Last updated 2026-10-05.