Diversification and correlation
Different asset classes do not all go up and down at the same time. By investing in a mix of them, rather than putting all your eggs in one basket, you aim to smooth out the ride: when one part of the portfolio falls, another may hold steady or rise. This is called diversification.
This page explains how Alfolio measures how closely investments move together, and what mixing them does for a portfolio. The examples use the same funds and years as Risk and reward (listed in The funds used on these pages).
Correlation
Correlation measures how closely two investments move together, on a scale from −1 to 1:
- 1: they always move in the same direction at the same time.
- 0: knowing what one did on a given day tells you nothing about the other.
- Below 0: they tend to move in opposite directions.
Alfolio works it out from daily returns: it compares, day by day, the percentage change in one with the percentage change in the other.
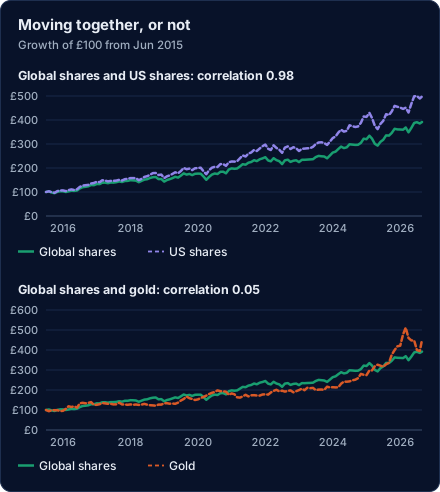
Correlation is about the day-to-day moves, not about which ends up higher. Global shares and US shares had a correlation of 0.98, yet US shares finished well ahead: they moved on the same days, but further. Global shares and gold both roughly quadrupled, yet their correlation was 0.05: they got there by different paths.
Correlation between kinds of asset
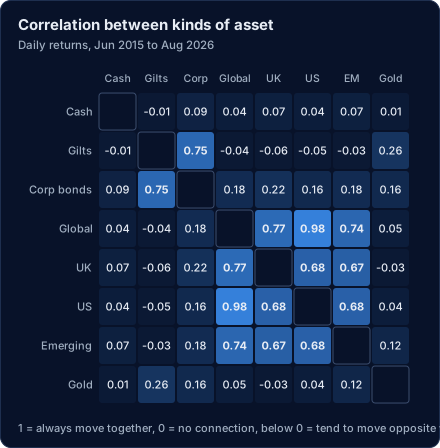
Over these eleven years:
- Shares from different parts of the world moved together, with correlations of 0.67 to 0.98. Owning several share funds spreads your money across more companies, but it does much less to smooth the ride.
- Gilts and corporate bonds moved together (0.75), because both respond to interest rates.
- Shares and gilts were almost unrelated day to day: −0.04 between global shares and gilts.
- Gold was almost unrelated to shares (0.05 with global shares).
Correlations measured over many years are averages. They can change, and they can fail exactly when they matter most: see When correlations break down.
What diversification does
Harry Markowitz, who won a Nobel prize for Modern Portfolio Theory, is often quoted as calling diversification "the only free lunch in finance": mixing investments can lower risk without giving up return.
Mixing two investments that do not move together gives a portfolio whose ups and downs partly cancel. Its volatility can be lower than you would expect from the two separately, and sometimes lower than either of them.
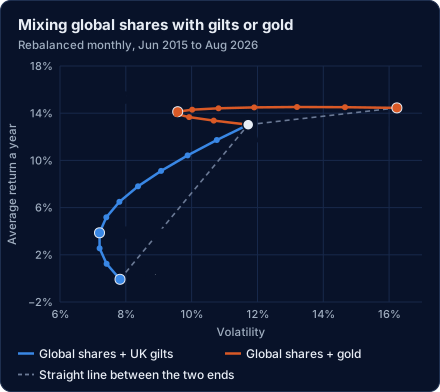
All gilts had a volatility of 7.8%. Swapping 30% of the gilts for global shares, which were more volatile on their own, brought the volatility down to 7.2% and the return up from −0.1% to 3.9% a year.
With gold the effect was larger. Shares and gold were each more volatile than gilts, 11.7% and 16.2%, but a mix of 60% shares and 40% gold had a volatility of just 9.6%, lower than either, while returning 14.1% a year, between the two.
Each dashed line is what mixing would give if the two always moved together: the mix's volatility would simply be the weighted average of the two. Each curve bulges to the left of its line. That gap is the benefit of diversification. The less two investments move together, the bigger it is.
The Sharpe ratio of each mix shows the same thing as return per unit of risk:
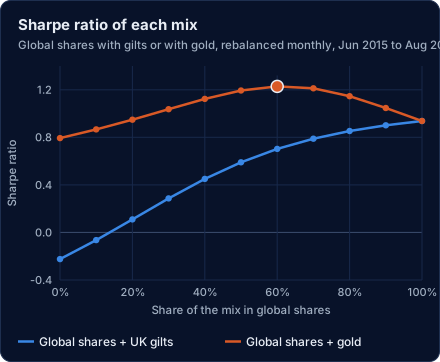
With gold, the best Sharpe ratio, 1.23, came from a mix of 60% shares and 40% gold: better than either on its own (0.94 for shares, 0.79 for gold), because the mix earned almost as much as either with much less volatility. With gilts, every step towards shares improved the Sharpe ratio, from −0.22 to 0.94. That reflects gilts' poor run after 2020, when they earned less than cash. Over June 2015 to December 2020 alone, before that run, the best mix of the two was 40% shares and 60% gilts, with a Sharpe ratio of 1.27 against 1.02 for shares alone.
The best mixes: the efficient frontier
With more than two investments there are countless possible mixes, and each has its own return and volatility. Plotted together they form a cloud. Its upper-left edge is made of the mixes with the highest return for each level of risk; nothing beats them on both at once. That edge is known as the efficient frontier.
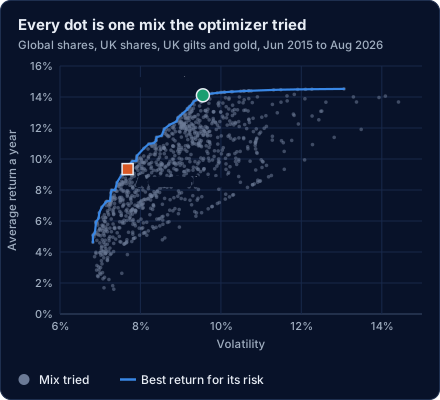
The portfolio optimizer draws exactly this cloud from the mixes it tries. Remember that the edge describes the past: the mixes on it are the ones that would have worked best over the years you chose, which is not the same as the ones that will work best next.
When correlations break down
Correlations measured in ordinary times can fail in a panic. When fear takes hold, investors sell whatever they can to raise cash. Funds and institutions that borrowed to invest face margin calls, demands to put up more money as prices fall, and meet them by selling their most easily sold holdings, including the ones that usually hold up. For a while, assets that normally move apart fall together.
The Covid sell-off is an example. Between 9 and 16 March 2020, global shares fell 7.1%, UK gilts 5.6% and gold 3.5%, all in the same week. Monthly figures hide it: by the end of March gold was higher than at the end of February. In 2022, rising interest rates hit shares and gilts together: global shares fell 8.3% over the year and gilts 23.6%.
So a low correlation measured over calm years can overstate how much a mix will protect you in a crisis. Diversification lowers the ups and downs on average; it does not stop everything falling at once.
Last updated 2026-10-07.