Risk and reward
Every investment is a trade between how much it might earn and how bumpy the ride might be. This page explains how Alfolio measures both, using one real fund for each kind of asset (listed in The funds used on these pages) over the same eleven years, Jun 2015 to Aug 2026.
Measuring reward
Alfolio measures what an investment earned as its total return: the change in its price plus any dividends or interest, reinvested, converted into pounds each day. A fund priced in dollars therefore includes what happened to the pound against the dollar.
Returns over several years are shown as an annualised return: the steady yearly rate that would have produced the same overall gain. That puts a ten-year record and a three-year record on the same footing.
Measuring risk
Alfolio's figures use two measures of risk.
- Volatility is how much the value moved up and down from one month to the next, as a yearly figure. A fund with 12% volatility gives a much bumpier ride than one with 6%.
- Maximum drawdown is the worst fall from a high point to a later low. It answers the question "how much could I have lost if I had bought at the worst moment?"
Both are needed. A fund can bounce around a lot and still never fall far, or move calmly and then fall a long way over several years:
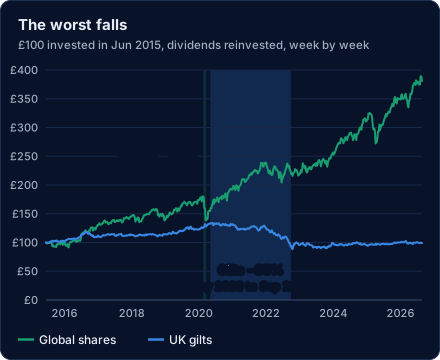
Global shares fell 26% in five weeks in early 2020, then were back above their old high by October 2020. UK gilts, often thought of as the safe choice, fell 35% between May 2020 and September 2022 as interest rates rose (see Interest rates, prices and duration), and were still 26% below their peak in August 2026.
Risk and reward compared
Each dot below is one asset class, represented by the fund listed in The funds used on these pages: its average yearly return plotted against its volatility, over the same eleven years.
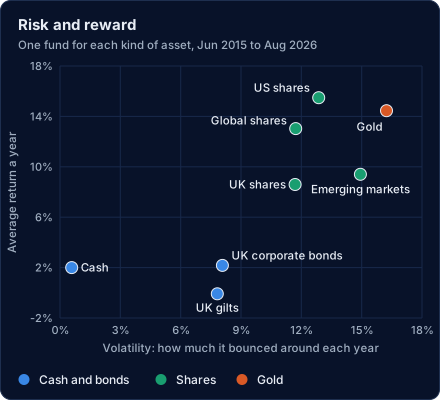
The broad pattern is the one investors expect: the funds that bounced around more mostly earned more. Global shares returned 13.0% a year, cash 2.0%.
But it is a tendency, not a rule. Over these years UK gilts returned −0.1% a year, less than cash, while being far more volatile. UK shares were as volatile as global shares but earned much less. The extra return you might get for taking risk is an average over long periods; over any one decade, it can fail to show up.
Returns are often shaped by long economic regimes that can end suddenly. Through the 2010s inflation and interest rates were low, and falling rates pushed up the prices of bonds: the same gilt fund returned 5.2% a year from 2010 to 2019. When inflation returned and interest rates rose quickly from late 2021, that regime ended, and the fund returned −3.1% a year from the end of 2019 to August 2026. A record built in one regime can say little about the next.
Other kinds of risk
Volatility and drawdown are the risks Alfolio can measure from prices. They are not the only ones that matter:
- Inflation. What counts is what your money will buy. A return of 3% a year with inflation at 4% is a loss in real terms, even though the figures show a gain.
- Falling short. The risk that your investments earn less than you need or expected, especially close to when you need the money. A fall just before you start drawing an income hurts more than the same fall twenty years earlier.
- Concentration. Too much in one company, sector or country.
- Currency. Funds that own foreign assets move with exchange rates as well as with their holdings.
- Counterparty. The chance that a bank, broker, fund provider or bond issuer cannot pay what it owes. Investor protection schemes have limits.
- Liquidity. Not being able to sell quickly at a fair price, as when property funds have suspended dealing.
None of these appear in a volatility figure, so a mix with low volatility can still be risky in other ways.
The Sharpe ratio
The Sharpe ratio is reward per unit of risk: how much a portfolio earned above cash, divided by how much that extra return varied. Higher is better. A Sharpe ratio below zero means cash would have done better, with no ups and downs at all.
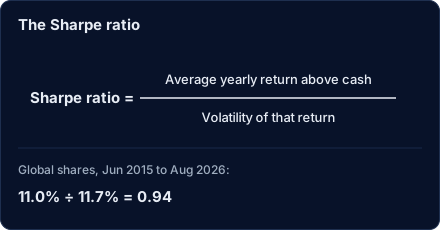
Over these eleven years, global shares had a Sharpe ratio of 0.94 and US shares 1.03. UK gilts had −0.22, because they earned less than cash.
How Alfolio works it out. For each month it takes the portfolio's return minus what cash earned over the same month. It averages those extra returns and scales the average to a year (the top of the fraction), then does the same for how much they varied (the bottom). To approximate the return on cash, Alfolio uses Amundi Smart Overnight Return (CSH2), a fund whose return closely follows SONIA, the benchmark interest rate for overnight lending in sterling.
The Sharpe ratio is useful for comparing combinations of assets (portfolios) with different levels of risk, which is why it is one of the optimizer's goals. It says nothing about how far a portfolio could fall, so look at drawdown too.
Past figures are not a forecast
Every number on this page, and in the portfolio optimizer, describes what has already happened. The relative performance of different asset classes can change completely from one year to the next:
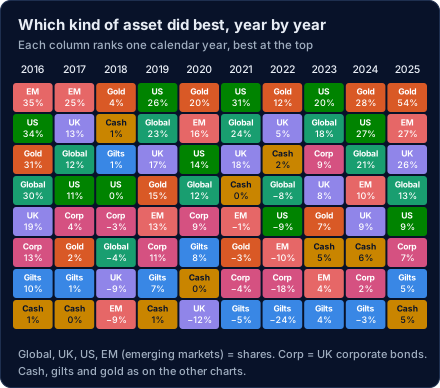
Emerging-market shares were the best of the eight in 2017 and the worst in 2018. Gold led in 2022, when gilts fell 23.6%. Use these figures to understand how different kinds of investment have behaved, not as a prediction of what they will earn.
Last updated 2026-10-07.