The portfolio optimizer
The optimizer takes the funds you give it and tries thousands of different mixes of them. It works out how each mix would have done over the past and ranks them against a goal you choose, such as the highest Sharpe ratio. Everything it reports is history. Read The best mix depends on the years before acting on a result.
What it does
For every mix it tries, the optimizer:
- starts with the mix's weights on the first day of the price history;
- lets the weights drift as prices move, putting them back on the rebalancing schedule you chose;
- works out the return, volatility, Sharpe ratio, maximum drawdown and correlation over the last 1, 3, 5 and 10 years and over the whole history;
- drops the mix if it breaks any of your constraints.
The prices are total returns in pounds, with dividends reinvested, the same as on the Risk and reward page. The mixes left are ranked by your goal, and the best 1,000 are shown.
The baseline portfolio
The baseline is your starting point: the funds and weights you want to improve on. Load a saved portfolio from Select Portfolio, or add funds one by one:
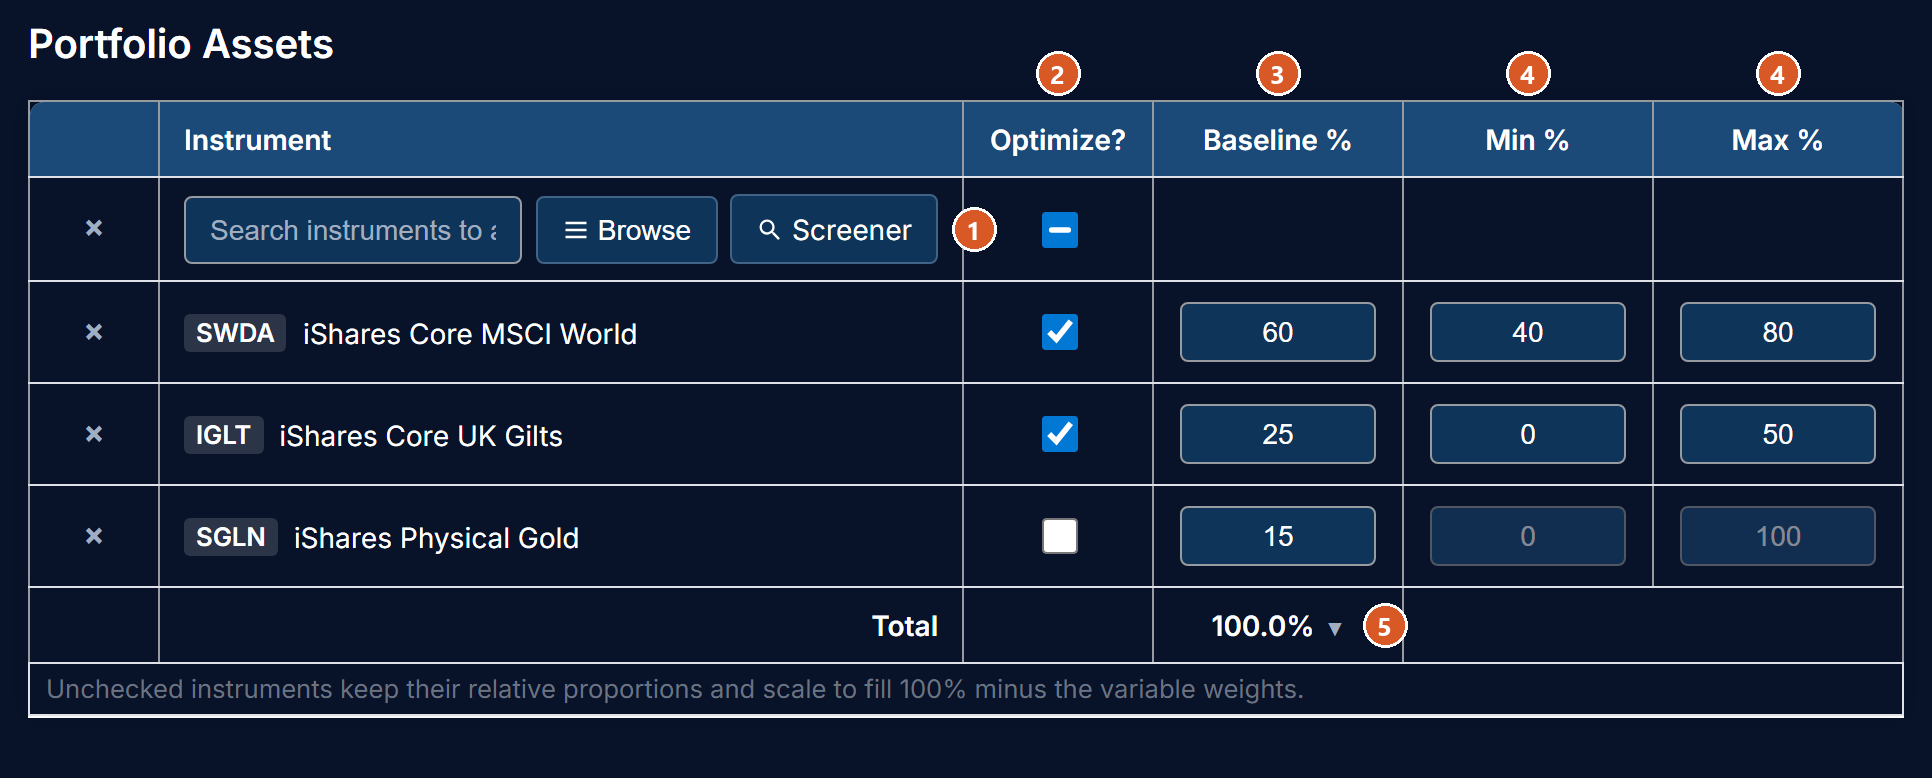
- Add funds: type a name or ticker, or use Browse or the Screener to find one.
- Optimize? Ticked: the optimizer may change this fund's weight. Unticked: the fund stays in every mix, and the unticked funds keep their weights relative to each other, taking up whatever the ticked funds leave. Two unticked funds at 20% and 10% always stay in a 2:1 ratio, but together they may end up above or below 30%.
- Baseline %: the fund's weight in your starting mix.
- Min % and Max %: the lowest and highest weight the optimizer may give a ticked fund. Above, global shares may range from 40% to 80% and gilts from 0% to 50%; gold is unticked, so it simply fills what is left in proportion.
- Total: the baseline weights must add up to 100%. Its menu can scale them to 100%, set equal weights or clear them.
The baseline itself is scored too, using the first rebalancing schedule you ticked, so you can see where it sits among the results.
The goal
The goal is what the optimizer ranks mixes by: Maximize or Minimize one of these figures, over one period.
| Figure | What it measures |
|---|---|
| Return | Average yearly total return |
| Std Deviation | Volatility: how much the value moved up and down |
| Sharpe Ratio | Return above cash per unit of volatility |
| Max Drawdown | The worst fall from a high, as a positive number |
| Weighted Avg Correlation | How closely the mix's holdings move together |
The period, 1Y, 3Y, 5Y, 10Y or Max, is counted back from the latest price. Max is the whole price history the funds share (see One young fund shortens the history).
Different goals favour very different mixes. Maximising return over one year, for example, will put as much as you allow into whichever fund did best in the last year.
Constraints
Constraints set limits on which mixes you are willing to accept. The goal decides how the mixes are ranked; constraints decide which mixes are allowed into the ranking at all.
For example, you might say: "I only want to consider mixes whose worst fall over the last ten years was no more than 15%." That is the constraint Max Drawdown, 10Y, < 15. Or: "I want the five-year volatility below 10%", which is Std Deviation, 5Y, < 10. Any mix that breaks a constraint is left out of the results, whatever its score on the goal.
Each constraint picks a figure, the period it is measured over, a comparison (less than, greater than) and a number. Drawdown is written as a positive number, so a 15% fall is 15. A mix is also left out if the constrained figure cannot be worked out for it, for example a 10-year figure when the funds share less history.
If no mix passes all your constraints, loosen one.
How the search works
The optimizer searches in two steps. Both are under Advanced Settings.
Step 1, spreading out. It tries the number of mixes set by Exploration budget (20,000 to start with), spread evenly across every weight your Min % and Max % allow, so that no part of the range is missed. (The method is called Latin hypercube sampling.) If you ticked several rebalancing schedules or drift bands, the budget is shared between them.
Step 2, looking closer near the best. It then takes the rebalancing option that produced the best mix and spends the Refinement iterations (500 to start with) searching near the best mixes. From up to 500 of the mixes tried so far, mostly the best, it builds a statistical model of how the goal changes as the weights change (a Gaussian process). Ten at a time, it picks the untried mixes the model thinks most likely to beat the best so far, tests them for real, and updates the model. This is known as Bayesian optimisation. Set Refinement iterations to 0 to skip this step.
Because both steps use random numbers, running the same settings twice can give slightly different winners.
Extending history with an index
Many funds are only a few years old. If a fund follows an index that Alfolio has history for, Extend history using tracked indices uses the index's movements for the years before the fund launched, joined smoothly onto the fund's own prices. The note under the tick box shows each fund's index and how many years it adds, and lists any fund without one, which will still limit the history.
Treat those early years as an approximation. An index has no fund charges and no tracking difference, and its history may only have month-end values.
One young fund shortens the history
The optimizer can only compare funds on days when all of them have a price. So the youngest fund sets the history for the whole portfolio:
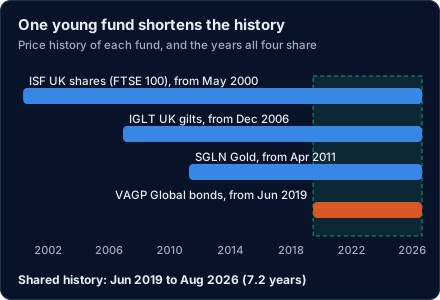
Add Vanguard's global bond fund, launched in Jun 2019, to three funds whose prices go back as far as 2000, and every figure is measured over the 7.2 years they share. A 10-year figure cannot be worked out, and is left blank (shown as a dash). If your goal or a constraint needs more years than the funds share, the optimizer says so and stops.
The line above the results table shows the price history used, for example price history Jun 2019 – Aug 2026 (7.2 years). Check it before reading anything else.
Reading the results
The chart plots every mix found. Choose what goes on each axis and what sets the colour. With volatility across and return up, it shows the cloud described in the efficient frontier:
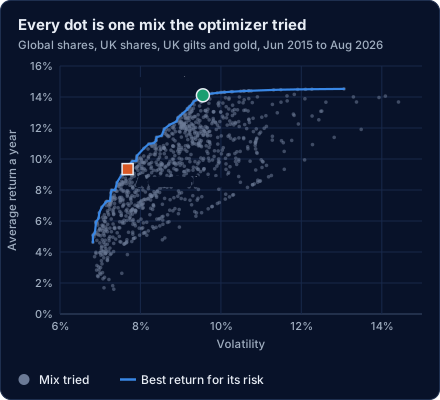
The table lists the mixes in order of your goal, with each fund's weight, the rebalancing schedule and drift band, and the figures for the period chosen above the chart. Columns adds other figures and periods. Click a row, or a dot on the chart, to select that mix: the buttons at the top then compare it with the baseline on a growth chart, make it the new baseline, or save it.
The line above the table says how many mixes were tried, how many were refined, how many passed your constraints, and the price history used.
How the figures are measured. Every mix is worked out day by day, whatever its rebalancing schedule. Return, volatility and the Sharpe ratio are then measured from its value at each month end, the same for every schedule, so a mix that is rebalanced less often cannot look calmer just because it is measured less often. Drawdowns use the daily values, so a fall that recovers within a month still counts.
Weighted average correlation
How closely the holdings in a mix moved together, from −1 to 1. The optimizer takes the correlation of every pair of holdings, from daily returns, and averages them, counting each pair by the two holdings' weights multiplied together. A pair of large holdings counts for much more than a pair of small ones.
Lower means more diversified. It works well as a goal combined with constraints: for example, minimise weighted average correlation with the constraint Return, 10Y, > 10, to find the most diversified mixes that still earned at least 10% a year. On its own, with no constraints, it favours whichever funds moved least like the others, whatever they earned. It can also be used as a constraint itself, such as Weighted Avg Correlation, 5Y, < 0.3.
The best mix depends on the years
Searching thousands of mixes for the one that scored best over a stretch of history finds the mix that happened to suit those years. A different stretch gives a different winner:
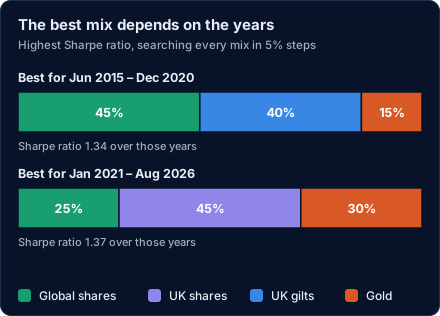
Suppose that at the end of 2020 you had chosen the best mix for the years before: 45% global shares, 40% UK gilts and 15% gold. Held from January 2021 to August 2026 it returned 6.7% a year, with a Sharpe ratio of 0.43. Simply putting a quarter in each fund returned 10.2% a year (Sharpe ratio 0.87), and the mix that turned out best, which nobody could have known in advance, returned 15.5%.
A few habits help:
- Prefer the longest history you can get, and check the result over more than one period.
- Look for mixes that score well across 3Y, 5Y and 10Y, not just the one you ranked by.
- Be wary of a winner with an extreme weight, or one that only just beats a simple mix.
- Treat the result as a starting point for your own thinking.
What is not modelled
The optimizer's figures leave out:
- Dealing costs and spreads on every trade, including each rebalance.
- Fund and platform charges beyond those already taken from a fund's price.
- Tax: dividends are reinvested in full and rebalancing creates no capital gains. Outside an ISA or pension, real returns would be lower.
- The future. Every figure is a backtest over the history you chose.
Real returns would be lower than the figures shown, by more for mixes that rebalance often.
Saving a result
Save Portfolio stores the mix so you can load it again or chart it. When you open the optimizer from a strategy or an account's target, Save to Strategy or Save Target makes the mix that target instead. Saving a mix does not make it a recommendation: it is the one that would have done best over the history you chose, before costs and tax.
Last updated 2026-10-07.