Index-linked gilts
An index-linked gilt is a gilt whose coupons and repayment rise with inflation. This page explains how that works and how to compare them with ordinary gilts. Read gilts first: everything there applies to index-linked gilts too, and this page covers what is different.
Conventional and index-linked gilts
There are two kinds of gilt. A conventional gilt pays fixed pounds: the coupons and the repayment are set in advance. An index-linked gilt (a "linker") raises its coupons and repayment in line with inflation, measured by the Retail Prices Index (RPI).
Conventionals suit spending that is fixed in pounds, such as paying off a known sum on a known date. Linkers suit spending that will rise with prices, such as living costs in retirement. They protect against inflation, but not against everything.
Why inflation matters for a conventional gilt is explained in yields and inflation.
You pay for that protection. Linkers usually offer a lower return than conventionals before inflation, and whether a linker or a conventional ends up better depends on what inflation actually turns out to be.
Alfolio labels linkers with an IL tag in the ladder and shows their yields as real yields.
The quoted price and what you actually pay
Modern index-linked gilts (issued since 2005) are quoted at a "real" price that leaves out all the inflation since the gilt was first issued. What you pay is that price multiplied by the index ratio, so it is usually far higher than the number you see quoted.
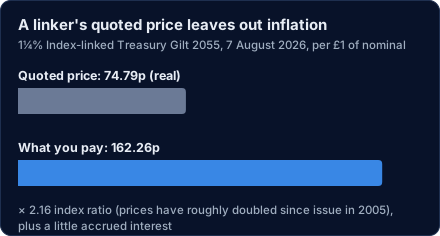
In August 2026 the 1¼% Index-linked Treasury Gilt 2055 was quoted at 74.79p (real). Prices had roughly doubled since it was issued in 2005, so its index ratio was about 2.16, and £1 of nominal actually cost 162.26p, including a little accrued interest.
Over the years the uplift grows as prices rise, so what you pay is a growing multiple of the quoted price. The chart shows a shorter-dated linker, the 1¼% Index-linked Treasury Gilt 2027, month by month:
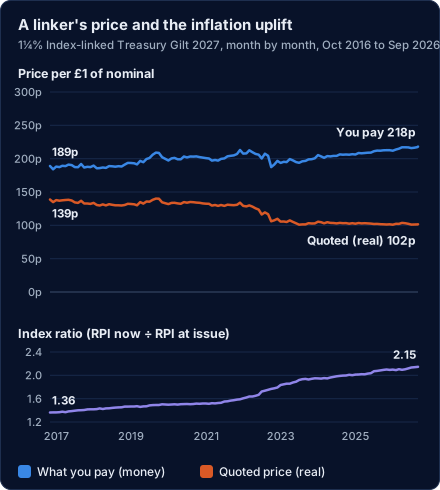
- The index ratio rose from 1.36 to 2.15, as RPI rose.
- The quoted price eased from 139p to 102p. As a linker nears maturity its real price heads towards 100p, the amount it repays before the uplift: the pull to par, in real terms.
- So what you would pay rose from 189p to 218p: the growing uplift more than made up for the falling quoted price.
The uplift protects what a linker pays you at maturity; it does not protect its market price before then. Longer-dated linkers can fall a long way when interest rates rise: see duration and what a linker protects you from. The month-by-month figures behind the chart are in this data file.
A few older linkers (issued before 2005) are quoted the other way, with inflation already included, so their prices look very high: around 240p to 340p. Both kinds can appear side by side in the bond ladder's Clean column.
In Alfolio: a modern linker's quoted price is marked (real), for example "74.79p (real)", at the top of its page and in the bond ladder. The ladder's Cost £ column and the prices of your own holdings are money, with the inflation uplift included.
Coupons and repayment on a linker
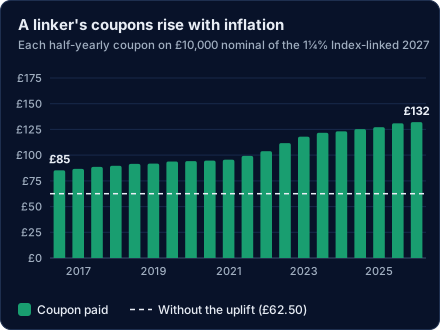
A linker's coupon is a real rate. It is worked out on the nominal and then multiplied by the inflation uplift at the time, so each coupon grows with inflation. A 0.125% linker pays 0.0625% of nominal every six months, times the index ratio.
For example, the 1¼% Index-linked 2027 pays a real 0.625% of nominal every six months, which is £62.50 on £10,000 nominal. With the uplift, its coupon on £10,000 rose from £85 in November 2016 to £132 in May 2026, rising faster in 2022 and 2023 when inflation was high:
The repayment works the same way: at maturity you get your nominal multiplied by the index ratio, so £10,000 nominal of a linker repays more than £10,000 if prices have risen since it was issued.
In Alfolio: a linker's coupon is shown with "(real)" after it, and its Cost always includes the inflation uplift so far.
How the inflation uplift works
An index-linked gilt's coupons and repayment are multiplied by an index ratio: RPI now divided by RPI when the gilt was first issued. If prices have risen by half since issue, the ratio is 1.5, so each payment is 1.5 times its real amount.
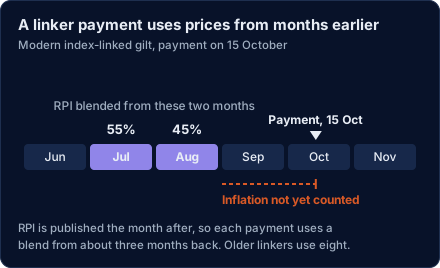
The lag. The "RPI now" in that sum is not this month's figure. RPI is published in arrears, so the gilt uses an older one:
- Modern linkers (issued since 2005) use RPI from about three months earlier. Within a month, the figure is blended day by day between the RPI from three months before and the RPI from two months before.
- Older linkers (issued before 2005) use RPI from eight months earlier, a whole month at a time.
The lag means that the last few months of inflation before a linker matures are never paid to you.
For a real example of the index ratio at work, and how it has changed over ten years, see the quoted price and what you actually pay.
Where the figures come from. RPI is published monthly by the Office for National Statistics as the RPI All Items Index (series CHAW). The Debt Management Office, which issues gilts for the government, publishes the official reference RPI and index ratio for every modern linker, day by day, so you can check Alfolio's figures against it.
In Alfolio:
- The index ratio is applied to every cost and cashflow but is not shown on screen. Alfolio works it out itself, the DMO's way, from ONS RPI and each gilt's base RPI (the reference RPI when it was first issued). Its base RPIs agree with the DMO's published figures to within a few hundredths of a percent.
- The ratio uses the latest RPI published by the Office for National Statistics. Shortly after a month ends, before its RPI figure is out, Alfolio uses the most recent figure it has. The ratio may then be a little out of date for a few days.
- Payments after today are estimates, because nobody knows future RPI. See the RPI assumption.
Real yield
For an index-linked gilt, the yield is a real yield: the return above RPI inflation if you hold to maturity. A real yield of 1% means your money grows 1% a year faster than RPI. A negative real yield means that, even held to maturity, it grows more slowly than RPI.
A real yield cannot be compared directly with a conventional gilt's yield. The inflation rate at which the two would do equally well is called the breakeven inflation rate.
In Alfolio:
- The ladder's Weighted YTM puts every bond on the same footing using your RPI assumption. In Nominal £ mode a linker's real yield is grossed up by it, (1 + real yield) × (1 + RPI) − 1, so the figure compares with ordinary gilt yields. In Today's money mode conventionals' yields are reduced by it instead, so every yield is a real one.
- The bond screener's single YTM column also mixes the two kinds. Check the bond type before comparing.
- A linker's duration measures how its price reacts to changes in real yields, not ordinary ones.
Breakeven inflation
The breakeven inflation rate is the average inflation at which a conventional gilt and an index-linked gilt maturing at about the same time do equally well. It is roughly the conventional gilt's yield minus the linker's real yield. If inflation turns out higher, the linker wins; if lower, the conventional gilt wins.
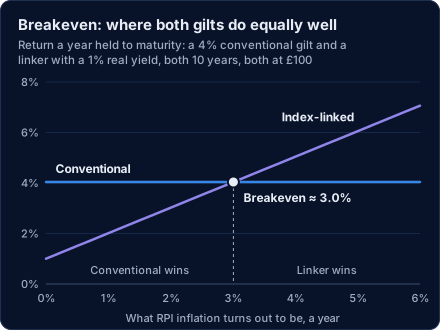
For example, a conventional gilt yielding 4% returns about 4% a year whatever happens to prices. A linker with a 1% real yield returns about 1% plus RPI inflation. If RPI averages about 3% a year, they come out the same, so 3% is the breakeven rate.
Breakeven is often described as the market's forecast of inflation, but it is not quite that. It is the rate at which investors are willing to swap fixed payments for inflation-linked ones, so it also includes what they will pay for protection against inflation surprises. It also changes every day with gilt prices.
It is measured in RPI, the index UK linkers are tied to, rather than the CPI figure usually quoted in the news. RPI is due to be calculated the same way as CPIH from February 2030, so for a linker maturing after 2030 the breakeven is in effect a blend: RPI up to 2030, and something close to CPIH after that. That is one reason breakevens on long linkers look lower than past RPI inflation would suggest. See the RPI assumption.
Choosing linkers over conventionals is in effect a bet that inflation will beat the breakeven rate, or paying for insurance in case it does. Choosing conventionals is the opposite.
In Alfolio: the ladder designer's Auto mix does not look at breakeven rates directly. It projects linkers at your RPI assumption and buys whichever is better value. So an RPI assumption above the market's breakeven tilts a design towards linkers, and one below it towards conventionals.
The RPI assumption
Future linker payments depend on inflation that has not happened yet, so Alfolio projects them using a yearly RPI rate that you choose. The default is 3%. Changing it changes every index-linked figure on the page, including the cost of income targets in today's money.
This is an assumption, not a forecast. Nobody knows what RPI will do, and the figures are only as good as the number you put in.
In Alfolio:
- Inflation is assumed to run at that one steady rate from today until each payment. Today's index ratio is the starting point, and it already includes the lag described in the inflation uplift.
- The planned change to RPI in 2030 is not modelled. From February 2030, RPI is due to be calculated the same way as another measure, CPIH, which has historically run about one percentage point a year lower. That would reduce linker payments after 2030. If you want to allow for it, use a lower RPI assumption.
- Upcoming coupons on the accounts page are worked out differently. When a coupon depends on RPI not yet published, it is marked est. and the missing months are projected at the latest RPI annual rate published by the Office for National Statistics, which updates each month. Hover over est. to see the rate used.
Returns and economic income on a linker
A linker's future payments depend on inflation that has not happened yet, so its hold-to-maturity return and economic income are projections. Alfolio works them out at your RPI assumption, and they change if you change it.
In Nominal £ they include the projected inflation. Switch to today's money to see the return above inflation, which for a linker held to maturity is close to its real yield.
What a linker protects you from, and what it does not
Held to maturity, an index-linked gilt protects the money you get back against rises in RPI. Each coupon and the final repayment grow with the index, so their buying power is fixed when you buy. That is a government-backed promise few other investments can match.
It does not protect you from:
- Price falls before maturity. A linker's market price can fall a long way if real yields rise, especially for long-dated gilts. Only the money paid at maturity is protected. If you might need to sell early, the price you get could be much lower than you paid.
- Inflation that RPI does not capture. RPI measures average shop prices. If your own costs rise faster, the linker will not keep up.
- The lag. The last few months of inflation before maturity are not paid. See the inflation uplift.
- Falling prices. Modern linkers have no floor. If RPI fell, coupons and the repayment would fall with it, even below £100 per £100 of nominal once all the uplift so far had been lost.
- A negative real yield. If you buy at a negative real yield, you will lose buying power even if you hold to the end. The protection works from the price you paid.
- The 2030 change to RPI. See the RPI assumption.
- Tax. Outside an ISA or pension, coupons are taxed as income, including the part that comes from inflation.
- Money waiting between payments. Once a coupon or repayment is paid, the cash is no longer protected. In a ladder, money waiting to be spent loses buying power. The ladder backtest shows this as Lost to cash waiting.
Nominal £ and today's money
Nominal £ shows the pounds you will actually receive. Today's money shows what those pounds would buy at today's prices, assuming RPI rises by your RPI assumption each year. The second view makes distant payments comparable with spending today.
In today's money, index-linked payments look level from year to year, and fixed payments from conventional gilts shrink over time.
In Alfolio:
- In the ladder and on bond pages, "today's money" uses your assumed RPI rate, not a forecast.
- The backtest tab is different. It looks at the past, so it uses the RPI that actually happened.
- The real-return figures on your accounts and performance pages use CPI, a different measure of inflation that usually runs below RPI. So "real" figures on bond pages and on account pages are not directly comparable.
- Plan projections show today's money by default, using the CPI rate set under Projection details. Plan backtests use the UK CPI that actually happened since each run's start, so a run's value is in the money of its start. Today's money is drawn in teal, nominal pounds in amber with a dashed line, and each chart's label says which it is. Your choice is remembered from page to page.
Last updated 2026-10-05.