Backtesting a strategy
The Backtest tab replays the strategy day by day over past years. It shows what the strategy would have done, not what it will do.
How the backtest works
A backtest runs the strategy day by day over past years with the same rules the live check uses: the same investments, incomes, transfers, checks and thresholds, applied to historical prices. It shows what the strategy would have done, not what it will do.
Each day the simulation revalues the accounts at that day's closing prices, credits the dividends the funds actually paid on their ex-dates (from the recorded dividend history, in cash), and then runs the same decision step as the live strategy. Trades are filled at the day's close. Dealing charges are taken from each account's broker setting. Platform fees, tax and currency costs are not modelled. See the known limitations for the data behind it.
Where the backtest starts
The backtest starts from today's holdings and cash, with the share counts adjusted to the prices at the start date, so the £ values and the mix match today's.
A holding with no price on the start date, such as a gilt issued later, has its value set aside as cash and is bought on its first priced day. The run uses the strategy's saved settings; to try different ones, change them, run the backtest, and change them back.
Bonds in a backtest
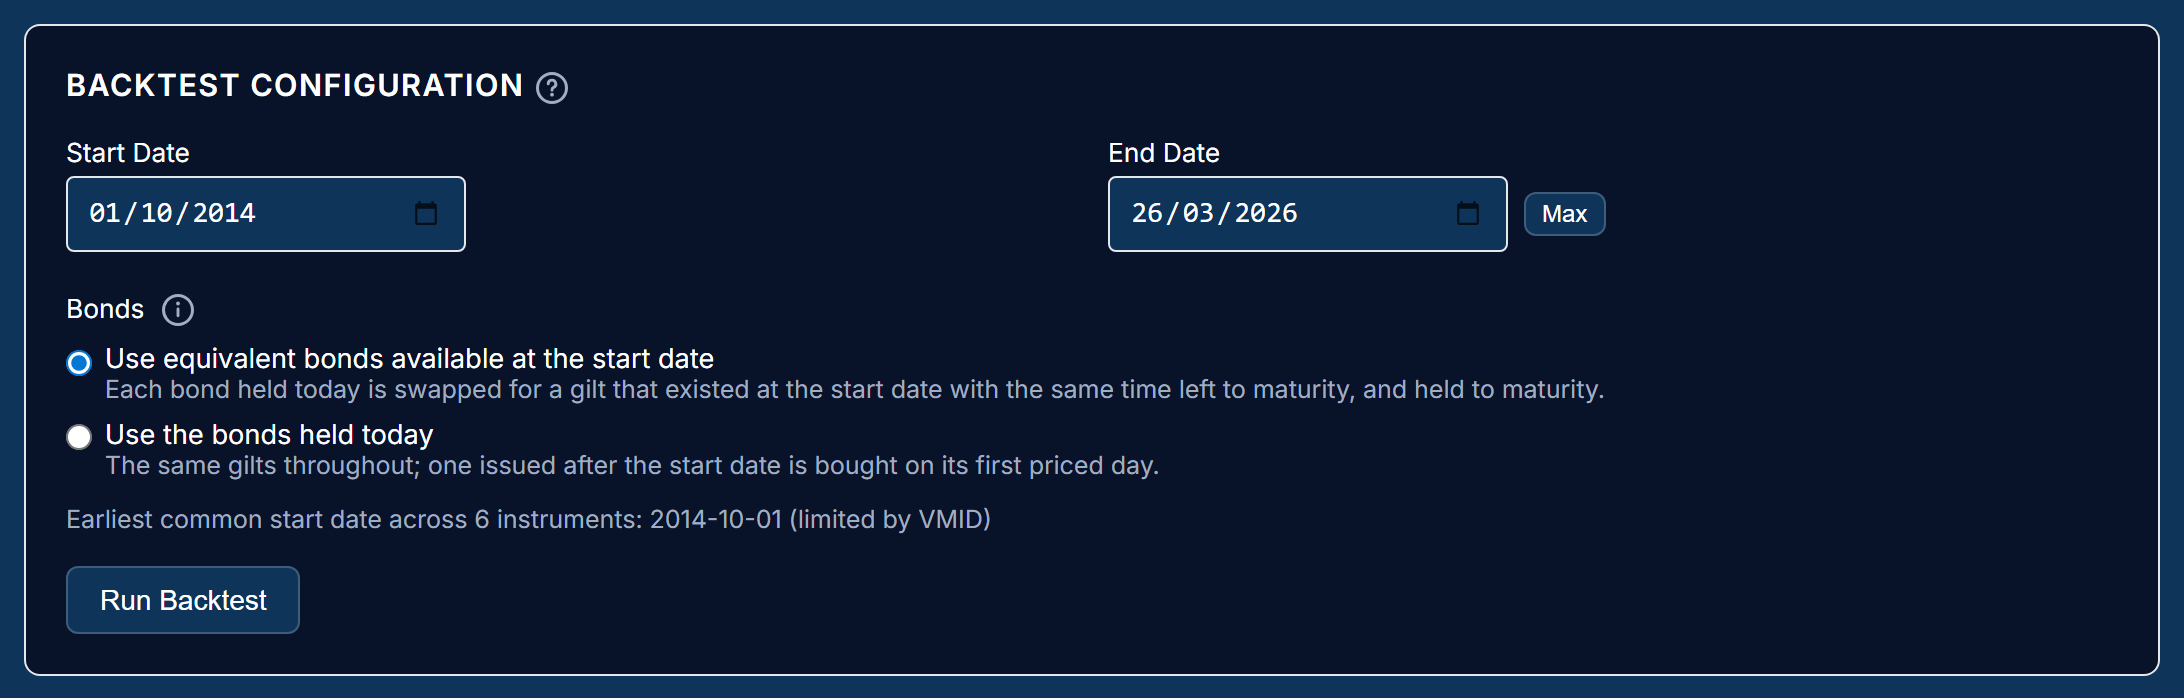
A gilt held today may not have existed at the start date, and one that did had a different time left to maturity. "Use equivalent bonds available at the start date" (the default) swaps each one for a gilt that existed then with the same time left to maturity.
So a 2-year rung today is replayed as a gilt that had about 2 years left at the start date, and it matures inside the backtest just as yours will. An index-linked gilt is swapped for an index-linked one. The results list each swap; a gap of more than a year between the two maturities is flagged, because no closer gilt existed.
"Use the bonds held today" keeps the same gilts throughout. That shows how these particular bonds traded, but a 2030 gilt in a 2015 backtest had 15 years left, not 4, so its price moved far more with interest rates than yours will.
In both modes:
- A gilt is repaid in cash on its maturity date.
- Index-linked gilts are valued in money (the real price times the index ratio), as on the holdings page.
- The rungs of a hold-to-maturity collection are never sold to rebalance, as in the live check.
- A collection chosen by criteria (a screen) is re-selected by those criteria at each rebalance, from the bonds that existed then.
The allocation chart shows the gilts as one band.
The net income chart
In drawdown, the income taken from the whole portfolio each month or quarter, split by where it came from: dividends and coupons, holdings sold, the cash buffer drawn down, and other cash.
- Dividends & coupons: dividends and coupons that were still cash in the accounts that paid the income or fed the buffer account (and in a locked account, when dividends count towards income from all accounts).
- Holdings sold: the part of the income sales that paid the income. Sales that rebuilt the buffer are not counted here.
- Cash buffer: how far the buffer fell to pay the income, as in a downturn.
- Other cash: anything else that paid it, such as a bond redemption or spare cash held before.
The parts are counted in that order and add up to the income paid, so a fall in the bars means less income, and a shift from "holdings sold" to "cash buffer" in a fall shows the buffer doing its job. Transfers and cash moved between accounts are not income and are not shown here: they are in the cash flows chart.
The drift chart
The largest drift of any holding from its target at the end of each period, with the strategy's threshold as a dashed line. Vertical markers show the days the strategy rebalanced.
A marker without the line being crossed is a scheduled action (an investment, an income, the first day); the line being crossed without a marker means the crossing fell between check dates.
Last updated 2026-10-17.